What is Temperature Mapping?
Temperature mapping is all the rage these days in the world of data analytics and facilities management. But what exactly is it? And why has it become so popular? In this tongue-in-cheek explainer, we’ll break down the science behind temperature mapping and look at how organisations use it to heat things up.
The temperature mapping is?

Temperature mapping is far from a new concept – thermometers have existed for centuries! But temperature mapping takes the idea to a whole new level. Rather than just taking spot temperature measurements, temperature mapping involves using special sensors and software to create detailed thermal models of environments like buildings and warehouses.
These models use thousands of data points to generate heat maps illustrating temperature variability across floors, rooms and machinery. While an individual thermometer reading only provides a single data point, temperature mapping offers a big-picture overview. Organisations can see hot and cold spots that point to energy waste, HVAC issues or potential equipment failures. Temperature mapping has evolved from cumbersome and costly to quick and convenient as technology has evolved. New Bluetooth and infrared sensors and user-friendly analytics dashboards have made the process faster and easier, expanding the practice from niche industrial and pharmaceutical uses to mainstream adoption.
The Significance of Mapping Temperatures.
Now, businesses of all types are using temperature mapping for purposes ranging from preventive maintenance to food safety monitoring. But at its core, the main appeal is simple – who doesn’t love a good heat map? Those swirling patterns and colourful graphics draw you in!
Cooking Up Food Safety with Temperature Mapping.

Precise temperature control is more critical in commercial kitchens and food processing plants than elsewhere. Proper heating, cooling, and storage temperatures are essential to prevent bacterial growth and foodborne illnesses. A few degrees outside approved ranges can mean the difference between safe food and a dangerous health hazard. Temperature mapping offers an efficient way to identify risks in sprawling food prep areas. Managers can monitor the entire operation from a central dashboard by deploying sensors on racks, cookers, refrigerators and other equipment. Alerts notify them of any fluctuations outside set parameters so issues can be addressed immediately.
Some systems even go beyond basic mapping to offer interactive floor plans. Managers can click on specific equipment to check current readings or analyse trends over time. It’s like having a real-time virtual map of the entire facility! For example, a large commercial bakery used mapping software to identify recurrent temperature spikes in one of their massive walk-in freezers. The alerts guided them to a demanding evaporator fan cutting out periodically, causing 10-15°F jumps before recovering. By replacing the faulty fan, they eliminated the temperature fluctuations that could have potentially ruined huge batches of frozen dough.
This level of visibility allows managers to optimise equipment usage and placements to maintain proper temperatures. Mapping data provides helpful documentation for regulatory inspections while doubling as an early warning system for problems. It’s a recipe for avoiding disastrous situations – talk about delicious compliance!
Temperature Mapping on Data Centres .
Temperature control is also mission-critical in data centres. These giant server farms pack tons of heat-generating electronics into compact spaces, and keeping temperatures sufficiently cool is essential to prevent the dreaded server meltdowns. But evenly cooling cavernous data centres is a monumental task. Hot spots can develop, particularly around high-traffic areas. Cold aisles that feed cooled air to equipment can develop leaks or bypass issues. Rogue servers crammed in without proper planning throw off airflow distribution. Just like an enterprise IT project gone wrong, things get messy fast!
Temperature mapping is crucial for understanding data centre thermal management. Densely placed sensors monitor racks for hot spots while also tracking room differentials. Mapping reveals bypass issues, inconsistent cooling, and general airflow problems. For example, data centres have standard hot or cold aisle layouts. However, one major cloud services firm found via mapping that their cold aisles were consistently several degrees warmer than desired. Detailed analysis revealed that cabling cut-outs along the aisles allowed cooled air to leak. By sealing these gaps, they reduced cold aisle temperatures by nearly 5°F.
Armed with temperature maps, facility managers can strategically redirect cooling resources to hot areas. Proactive airflow balancing and containment controls prevent minor issues from cascading into significant failures. The result is optimally efficient cooling, lower energy bills and fewer angry calls from server monitoring techs.
Research Labs Heat the Search for Cures.

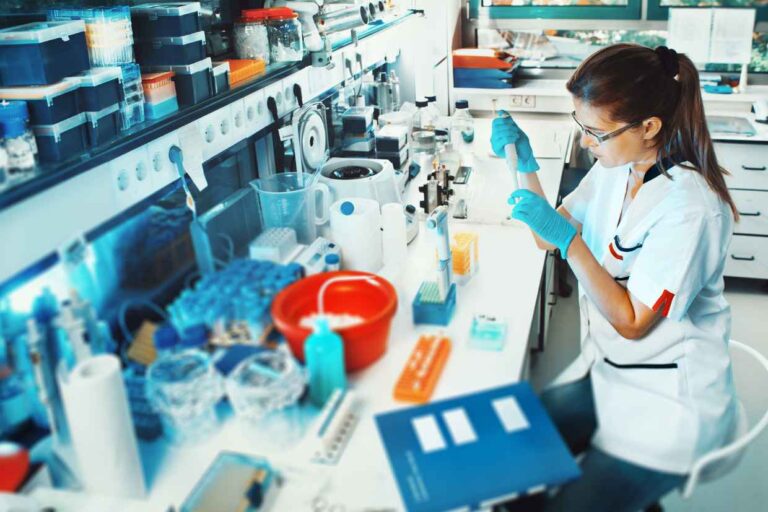
Pharmaceutical researchers have utilised temperature mapping for years to safeguard sensitive experiments. Strict temperature control is mandatory for cell and tissue cultures or biological samples. Even minor deviations can completely invalidate test results. Mapping helps ensure consistency across large labs with many humidity-controlled chambers and incubators. Portable sensors placed inside devices can track performance over time. Labs can also catch problems like worn door seals, finicky compressors, or defrost cycle issues before they ruin valuable experiments.
For example, a cancer research lab noticed unusual temperature variations in one of their CO2 incubators used for growing cell cultures. Mapping data helped them pinpoint the cause – a slowly failing internal fan that caused heterogeneous heating. Replacing the fan maintained the stable 5% CO2 and 37°C needed for proper cell growth. The highly detailed historical data supports proper lab management as the researchers cycle through equipment. Repair and replacement decisions can be made based on actual observed runtimes. Equipment usage trends also help inform future purchases and layouts as labs expand. As a bonus, detailed mapping provides indispensable data when applying for grants or collaborating with partners. Comprehensive temperature records validate a lab’s ability to produce sound, replicable science. That can be the difference-maker when seeking critical funding and resources.
Turning Down the Heat
Temperature mapping provides some significant benefits for energy efficiency, food safety, data centre ops and lab work. But does your average office or store need that kind of intense thermal surveillance? Probably not so much. While the concept is red-hot at the moment, there are still some limitations regarding costs and practical applications. Also, complex analytics are overkill for more basic thermostat setbacks and HVAC upgrades. For many, simple programmable and smart thermostats do the job just fine. However, temperature mapping will likely spread to more mainstream buildings as technology advances. With costs decreasing and data visualisations getting even more innovative, thermal monitoring could go from trendy to worldwide. More affordable DIY sensor kits now allow even home users to experiment with mapping. Ambitious homeowners can track detailed thermal patterns across rooms, identify air leaks, and analyse HVAC system performance. Whether optimising for comfort or energy savings, home mapping provides valuable insights.
As sensors get smaller and smaller, we may eventually see mapping move to even smaller niches. Tiny wireless thermometers could map temperature profiles inside cabinets, on pipes, or even across circuit boards. The possibilities are limited only by the imagination and the pace of miniaturisation. After all, who wouldn’t get a kick out of seeing their office or home converted into a slick heat map? It really adds some sizzle and excitement to otherwise dull temperature management. The heatmap hype is undoubtedly far from burning out! So there you have it- the inside scoop on the rapidly rising thermal mapping trend. It may seem niche and geeky on the surface, but the numbers don’t lie. Temperature mapping can unlock significant efficiencies and cost savings when applied correctly. Vendors are cooking up new use cases and applications as we speak. This is one innovative technology that has some severe heat behind it!


